HughesON Portal
Client: Hughes Network Systems

Summary
HughesON Portal is an enterprise customer portal of Hughes Network Systems, used by all enterprise customers to monitor, manage, and troubleshoot large-scale satellite networks across thousands of distributed locations.
This upgrade project focused on modernizing a legacy application to better support operational, technical, and executive users. The initiative included comprehensive design enhancements, technology upgrades, and performance optimization, while introducing responsive design, an updated information architecture, and a reimagined dashboard experience.
Scope
Research Synthesis
Aligning user needs, data complexity, and operational workflows into actionable experience drivers.
UX Challenges
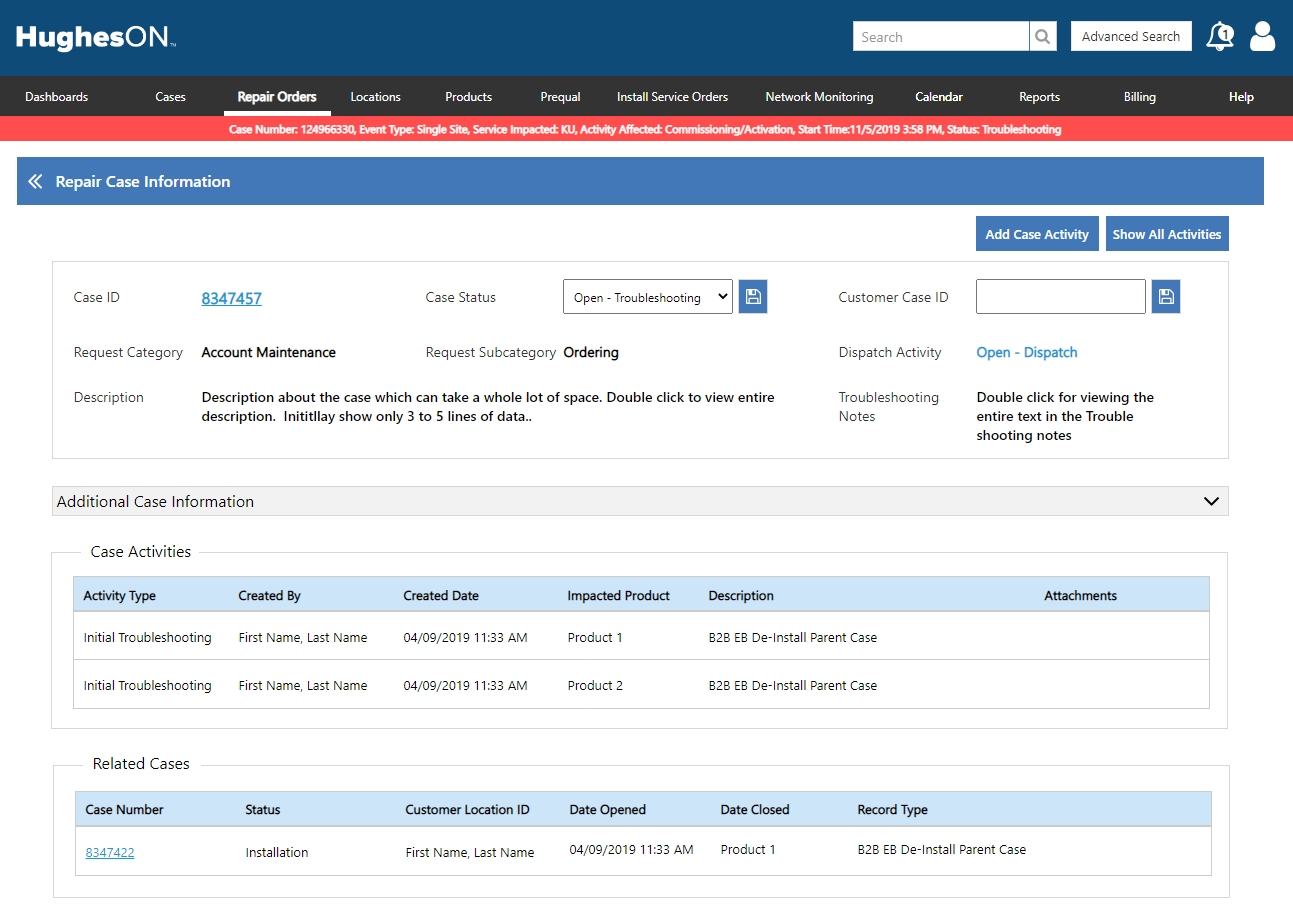
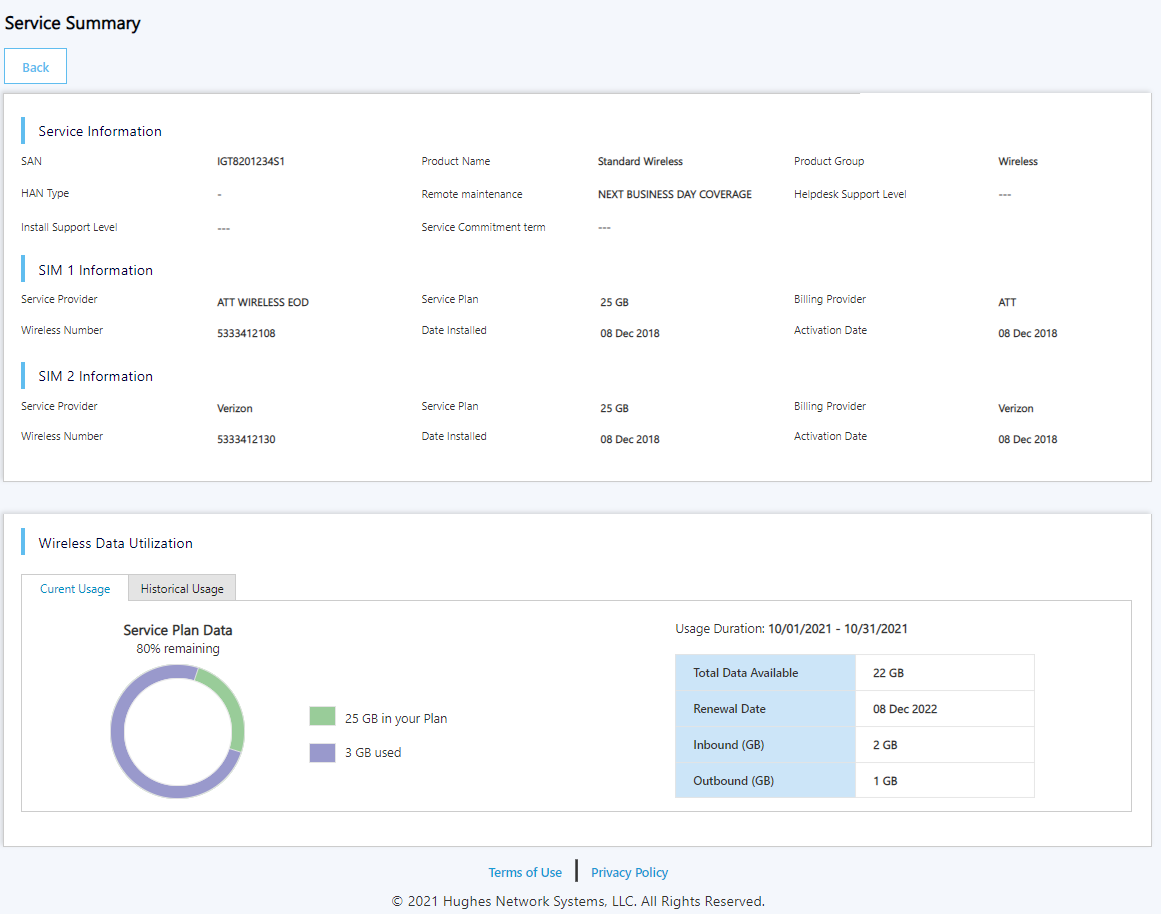
- Information was fragmented across alerts, cases, installs, repairs, locations, services, and devices, forcing users to navigate without context.
- Dense data tables, inconsistent filtering, and unclear hierarchy increased cognitive load and slowed decision-making.
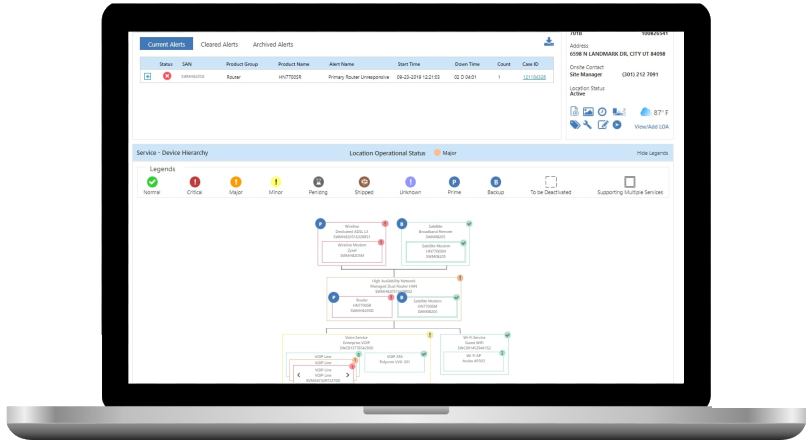
- Static maps did not support real operational workflows such as filtering, anomaly detection, or triage.
- Overall, the system lacked a coherent information architecture, prioritization model, and interaction consistency.
Users & Core Needs
- Primary users: Network Administrators, Operations Teams, Support Analysts, and IT Directors—each operating at different levels of abstraction.
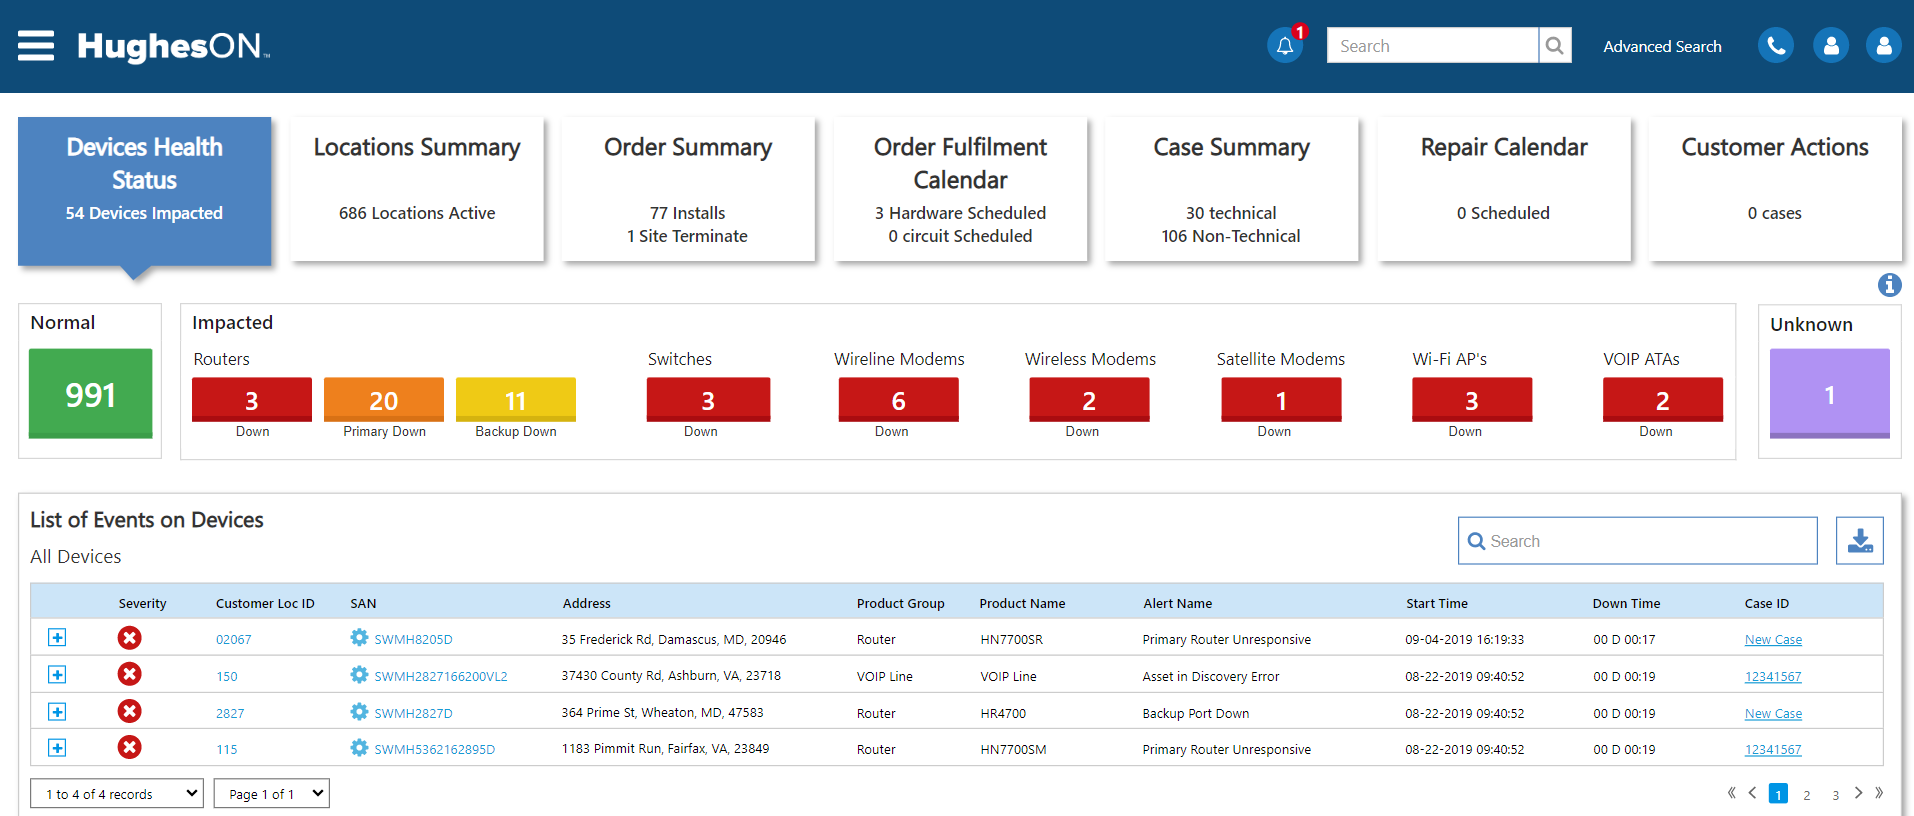
- Users needed instant visibility into overall network health with clear severity indicators.
- Fast triage and the ability to drill down seamlessly from macro → micro → root cause were critical.
- Consistent interaction patterns across modules were essential to reduce learning friction.
Key Insights
- TResearch combined stakeholder interviews, SME workshops, contextual inquiry, heuristic evaluation, competitor benchmarking, and support ticket analysis.
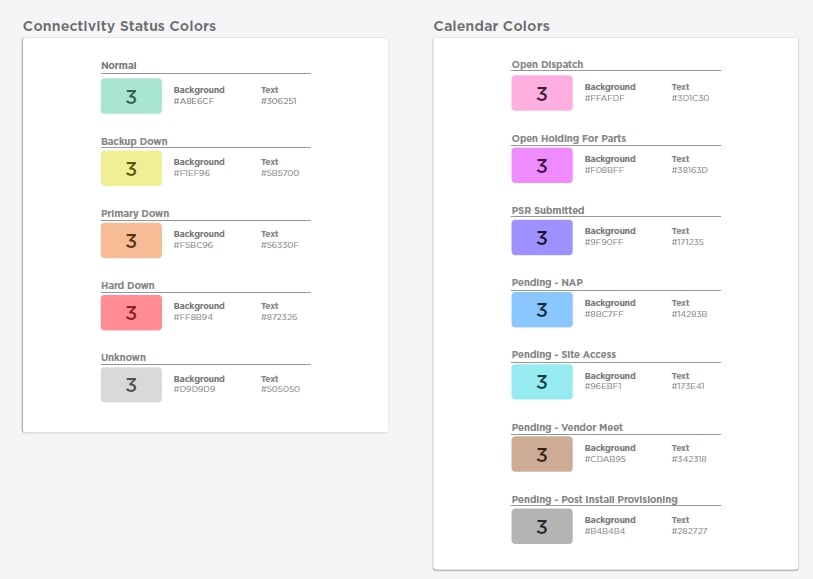
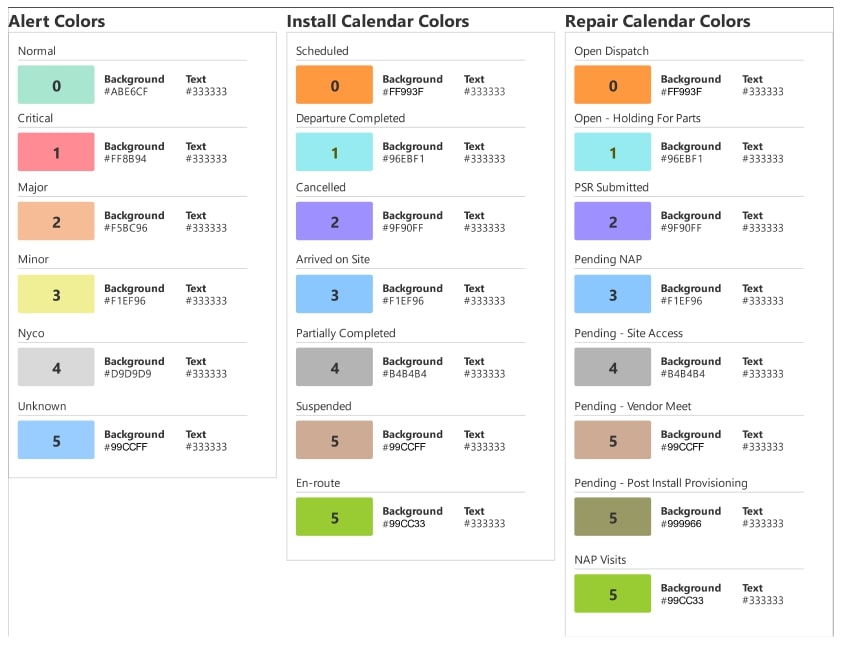
- Users relied heavily on visual cues such as color coding and severity indicators to assess system health.
- Dashboards needed to surface anomalies and risks first, rather than static metrics.
- Alerting had to follow clear escalation logic and reflect real device–service relationships, directly informing the IA and interaction model.
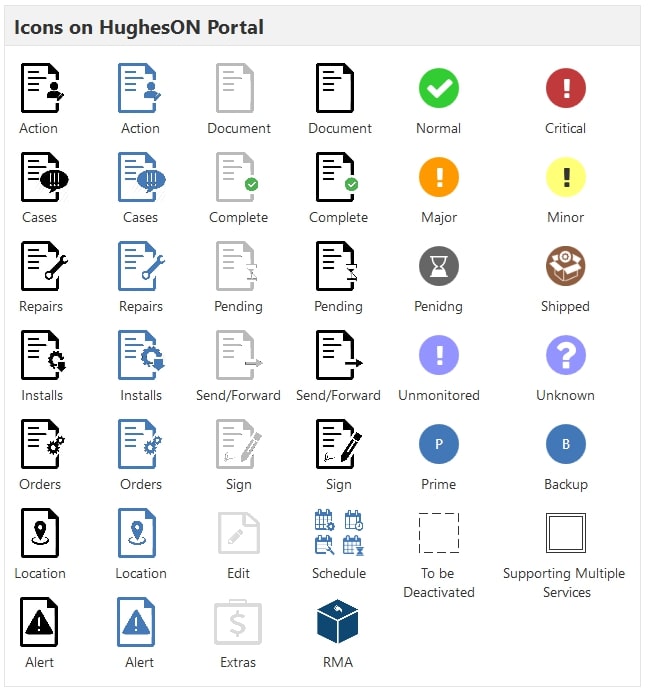
UI Kit
As a core design-system artifact, the UI kit defines reusable components and visual standards that support a cohesive, vibrant application experience.

Wireframes